Understanding Car Fuel Economy: What Those Numbers Actually Mean
When you're shopping for a new car, fuel economy figures are everywhere. But what do they actually mean? And which number should you pay attention to? If you've ever been confused by terms like "Combined cycle" or wondered why some cars show better figures for city driving than highway, you're not alone. This guide breaks down everything you need to know about fuel economy ratings in plain English.
What is L/100km?
In Australia, fuel consumption is measured in litres per 100 kilometres (L/100km). This tells you how many litres of fuel a vehicle uses to travel 100 kilometres. The lower the number, the less fuel the car uses. A car rated at 5.0 L/100km uses half as much fuel as one rated at 10.0 L/100km over the same distance. To put it in real terms: if you drive 15,000km per year and fuel costs $2.00 per litre, a car using 5.0 L/100km would cost you $1,500 in fuel annually. A car using 10.0 L/100km would cost $3,000. That's a $1,500 difference each year.
The Three Fuel Economy Figures Explained
All new cars sold in Australia must undergo standardised fuel consumption testing under ADR 81/02 (Australian Design Rules). This testing produces three separate figures, each representing different driving conditions.
Urban Cycle
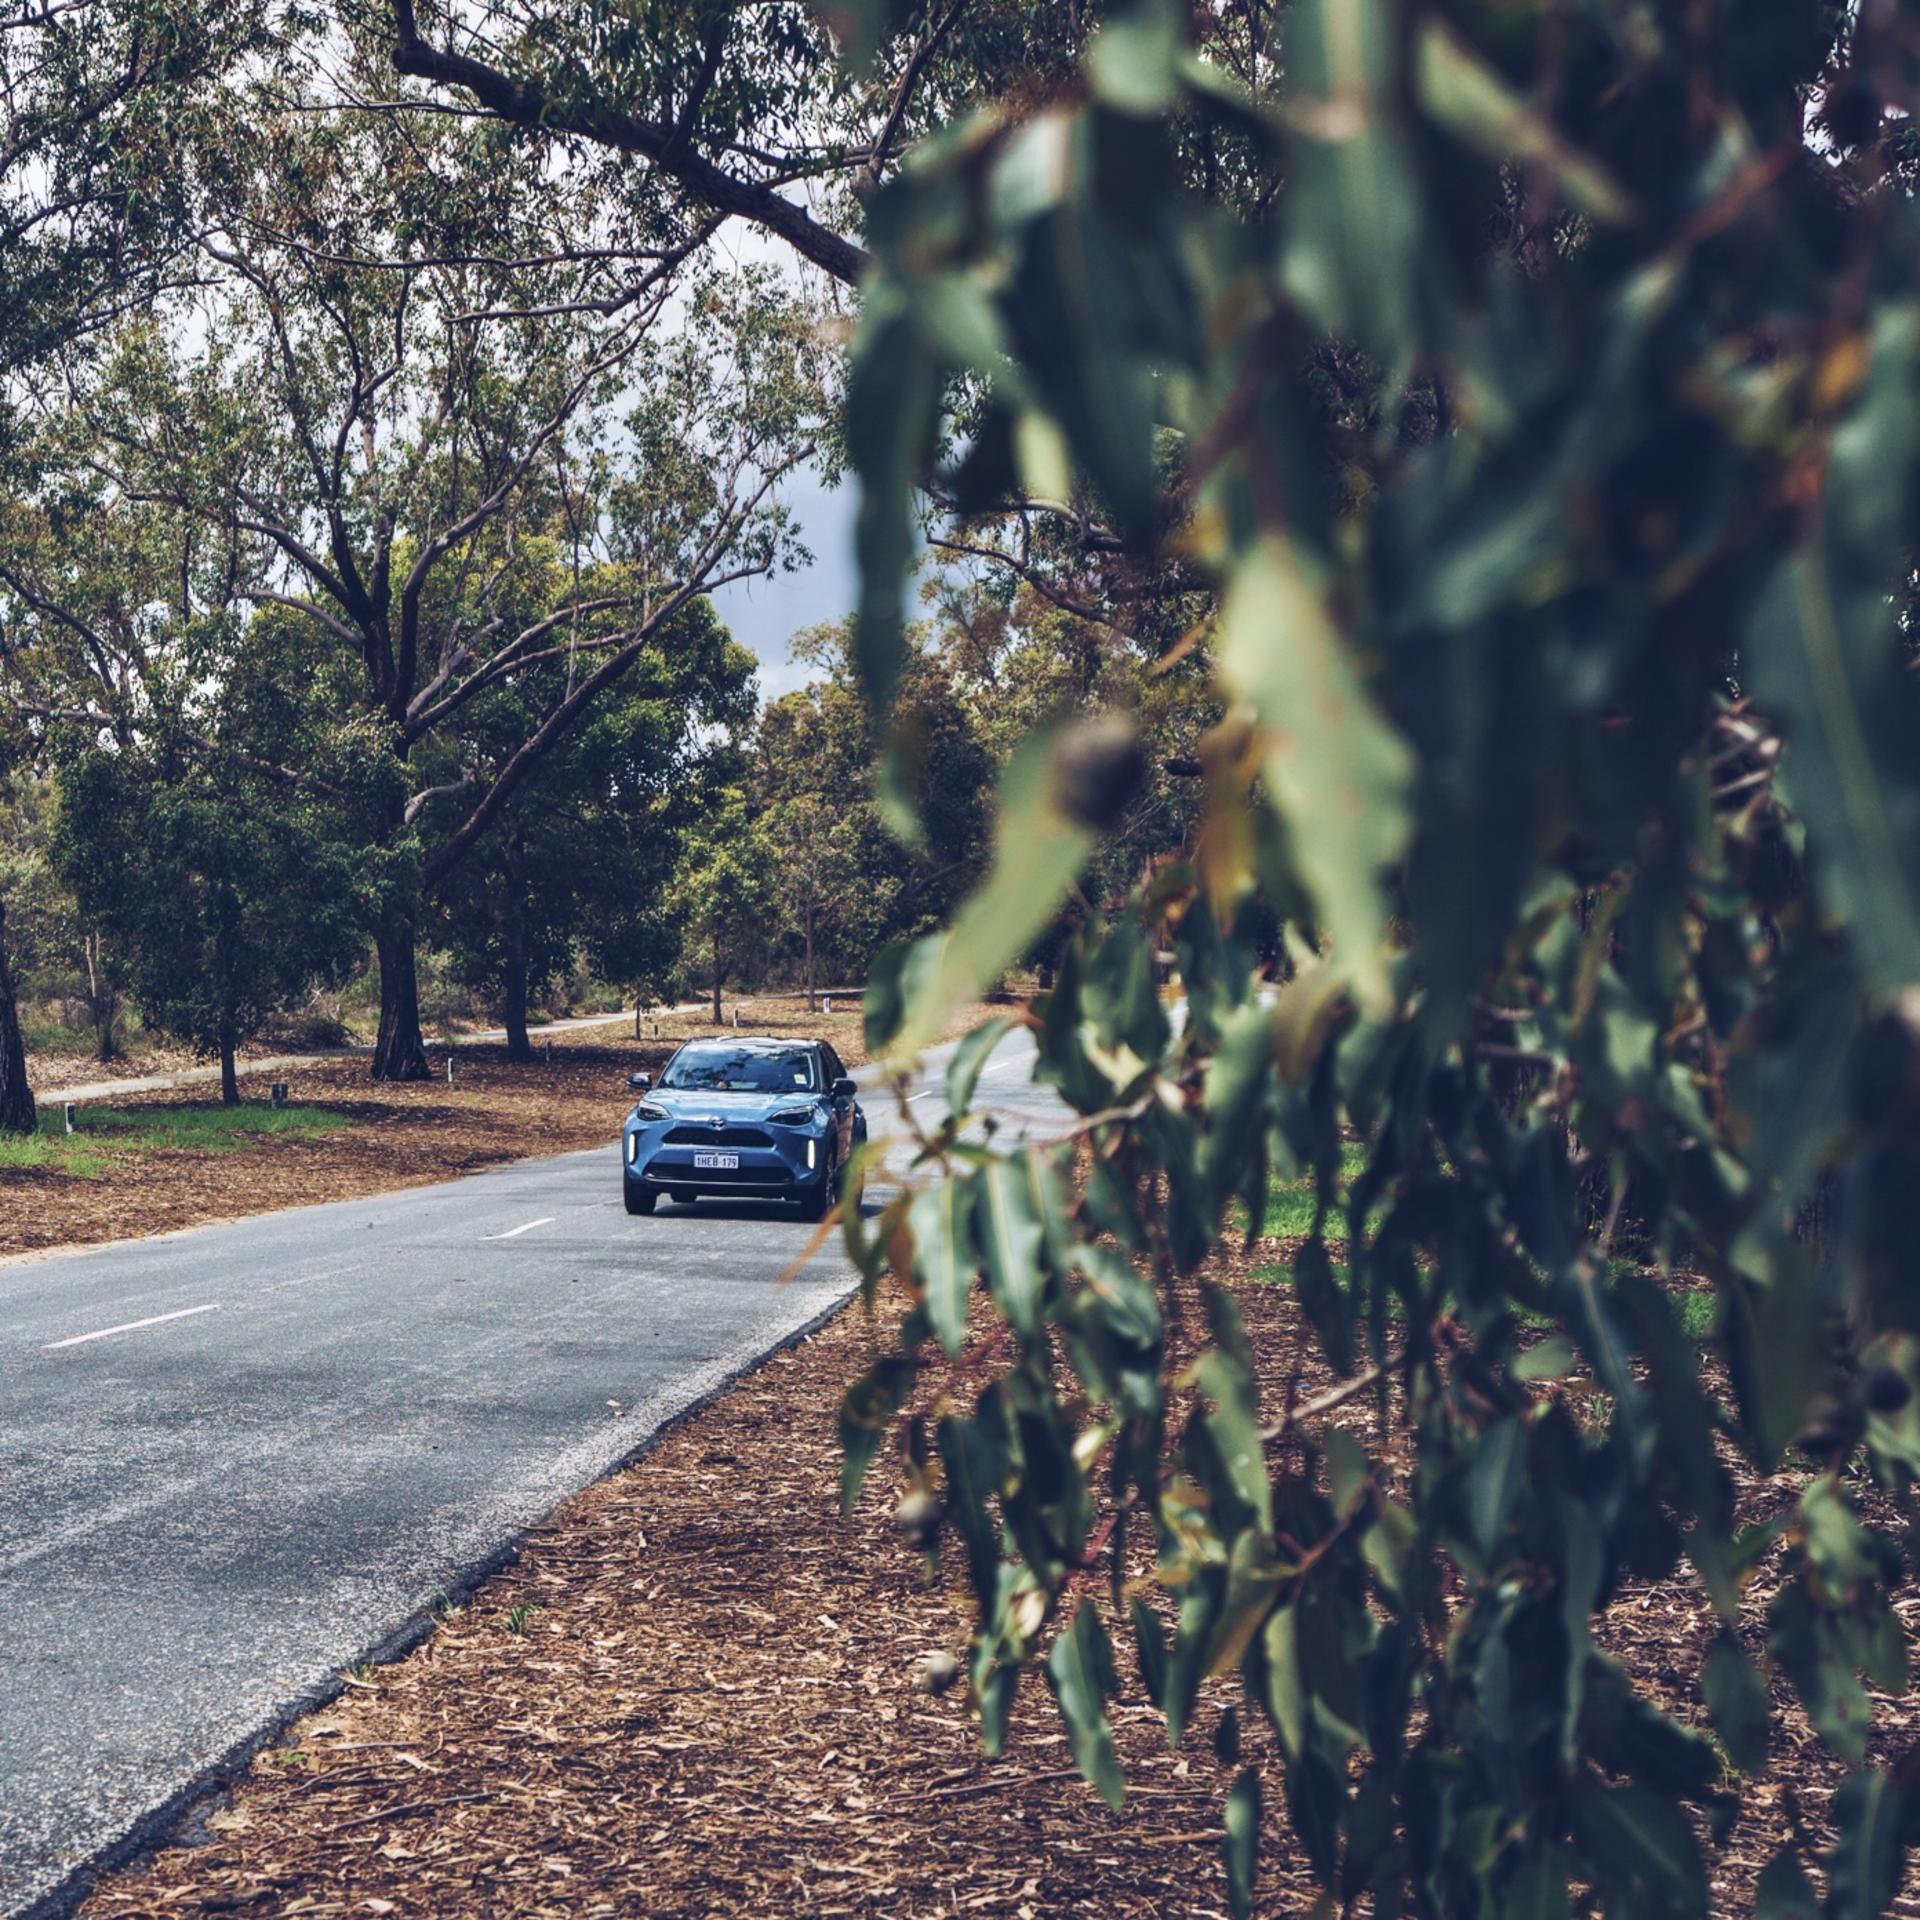
The Urban cycle simulates city driving. Think of your typical commute through Perth's suburbs: traffic lights, roundabouts, school zones, and speeds up to about 50 km/h. The test includes frequent stopping and starting, idling, and short bursts of acceleration.
Who should focus on this figure:
If you regularly drive long distances, commute on highways, or take frequent road trips, the Extra Urban figure will be more relevant to your actual fuel costs.
Conventional vs Hybrid:
At sustained highway speeds, the petrol engine does most of the work in a hybrid, and there's less opportunity for regenerative braking. This is why conventional diesel vehicles often perform relatively better in Extra Urban conditions compared to their Urban figures.
Extra Urban Cycle
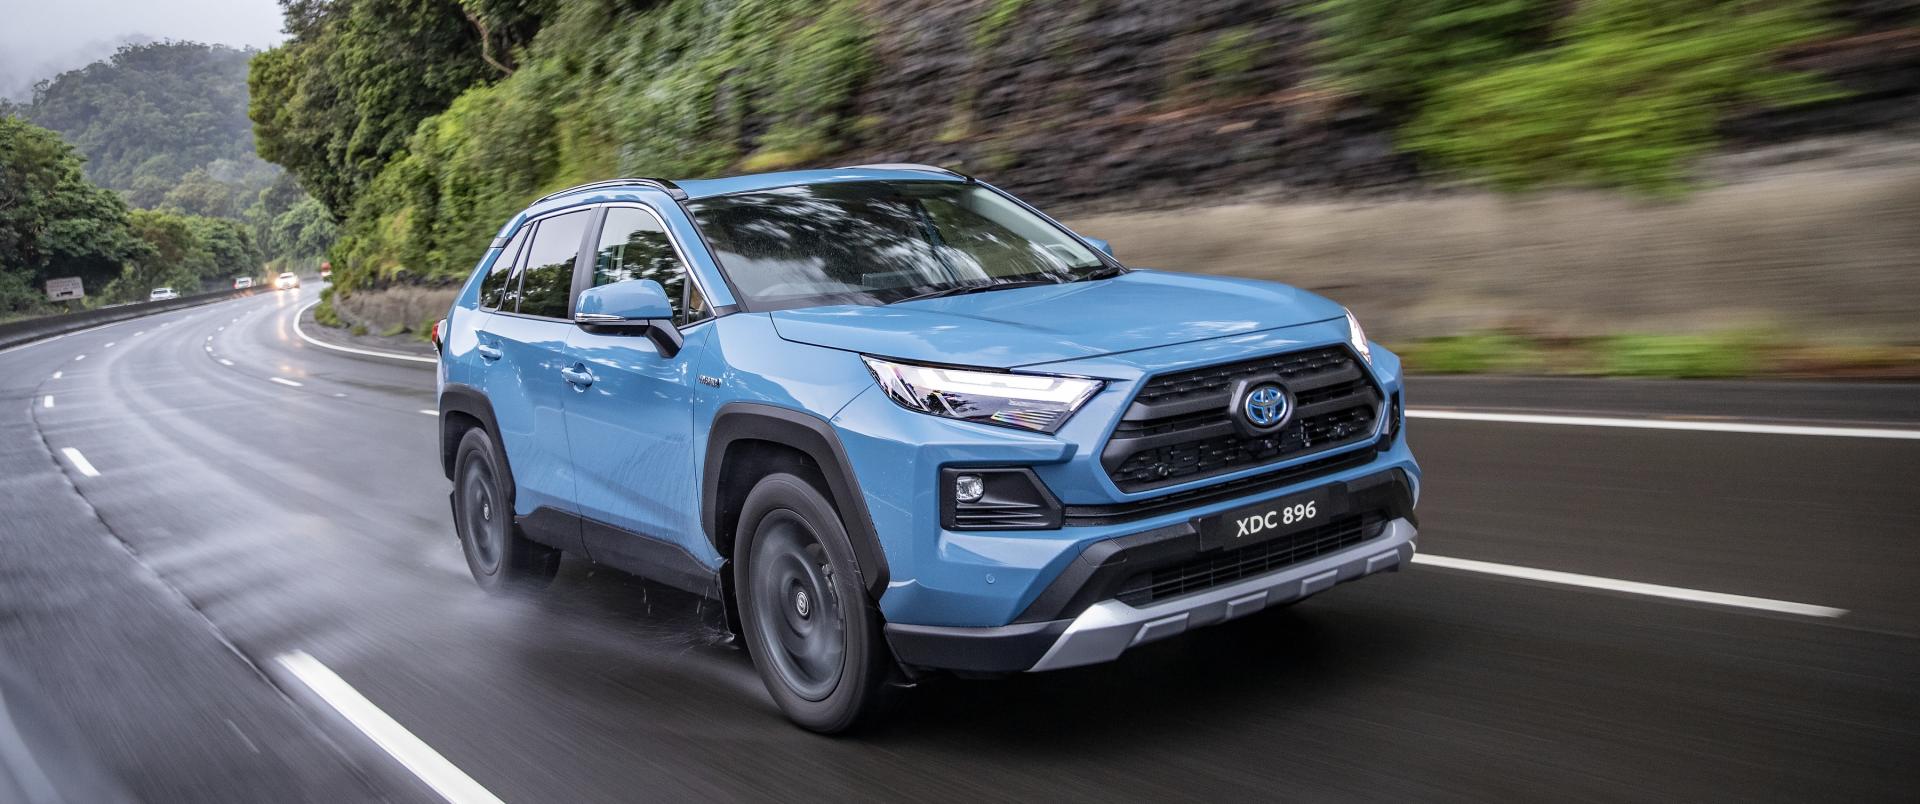
The Extra Urban cycle represents open road and highway driving at sustained speeds up to 120 km/h. Think of trips down to Mandurah, out to the Swan Valley, or cruising on the freeway.
Who should focus on this figure:
If you regularly drive long distances, commute on highways, or take frequent road trips, the Extra Urban figure will be more relevant to your actual fuel costs.
Conventional vs Hybrid:
At sustained highway speeds, the petrol engine does most of the work in a hybrid, and there's less opportunity for regenerative braking. This is why conventional diesel vehicles often perform relatively better in Extra Urban conditions compared to their Urban figures.
Combined Cycle
The Combined figure is a weighted average of the Urban and Extra Urban results. It's the headline number you'll see in most advertising and provides a useful benchmark for comparing different vehicles.
However, remember that your real-world fuel consumption will depend on your actual driving mix. If you do mostly city driving, expect results closer to the Urban figure. If you're predominantly on highways, the Extra Urban figure will be more accurate.
Why Real-World Figures Differ from Official Ratings
Official fuel consumption figures are achieved under controlled laboratory conditions. They provide a consistent basis for comparison, but your actual fuel economy will vary based on several factors.
Driving style
Driving style
Aggressive acceleration and hard braking increase fuel consumption significantly. Smooth, anticipatory driving can improve your economy by 10-20%.
Climate Control
Climate Control
Air conditioning increases fuel use, particularly in Perth's hot summers. The official tests are conducted at a mild 23°C without air conditioning running.
Traffic Conditions
Traffic Conditions
Heavy traffic with extended idling will increase consumption beyond the official Urban figure.
Load
Load
Carrying passengers, cargo, or towing increases fuel consumption. Roof racks and accessories add aerodynamic drag.
Terrain
Terrain
Hilly routes like those around the Perth Hills require more fuel than flat roads.
Tyre Pressure
Tyre Pressure
Under-inflated tyres increase rolling resistance and fuel consumption.
Calculating Your Annual Fuel Costs
Calculating Your Annual Fuel Costs
Understanding fuel economy helps you budget for running costs. Here's a simple formula:
Annual Fuel Cost = (Annual km ÷ 100) × L/100km × Fuel Price
For example, if you drive 15,000km per year in a car that uses 7.0 L/100km, and fuel costs $2.00 per litre:
(15,000 ÷ 100) × 7.0 × $2.00 = $2,100 per year
Compare that to a vehicle using 10.0 L/100km:
(15,000 ÷ 100) × 10.0 × $2.00 = $3,000 per year
That's a $900 annual saving, or $4,500 over five years of ownership.
Which Figure Should You Focus On?
The answer depends on how you drive. Here's a quick guide:
Mostly city driving (suburbs, school runs, short trips): Focus on the Urban figure.
Mostly highway driving (long commutes, regular road trips): Focus on the Extra Urban figure.
Mixed driving (a bit of both): The Combined figure is your best reference.
When comparing vehicles, look at all three figures. A car with excellent Urban economy but poor Extra Urban performance might not suit someone who does regular highway driving, and vice versa.
Find Your Perfect Match at Kalamunda Toyota
Now that you understand what fuel economy figures mean, you're better equipped to choose a vehicle that matches your driving habits and budget. At Kalamunda Toyota, we can help you explore Toyota's range of fuel-efficient vehicles, from hybrid small SUVs to 48V Active Technology work vehicles. Our team understands how different driving patterns affect real-world fuel economy and can help you find the right fit for your lifestyle.
Book a test drive and experience the difference for yourself.
More Blogs For You


← Swipe →